v1 Jan-2026
About the light curves: An occultation is recorded by video with GPS time (or NTP computer time) inserted on the frames using the recording software. Timings are made with an accuracy of 0.1 sec (typically), or better when conditions allow. The start and end time (UT) of an occultation is found from the light curve. This is obtained using Tangra software (Hristo Pavlov) by measuring the relative brightness change of the occulted star in the video. It's usual to measure at least one other star for comparison ( the "comparison star"). The occulted star is usually the blue line.
In cloudy conditions the lines will drift around. We can use the comparison star to "normalise" the light curve. (Remove the drift and make the event clearer.)
Reports are prepared with OccultWatcher software, and uploaded to the SODIS database, maintained by IOTA-ES where the result is checked.
The l ight curves are typical of our observations. Signal to Noise Ratios (SNR) tend to be low ( 3 - 7) because the occulted stars are faint (magnitude +12 to +14) and the exposures need to be brief (0.5 to 0.05s). Short exposures retain the time resolution needed to measure the asteroid's dimensions. (TNO example: Varda in A&A - D.Souami et al 2020)
White backgrounds to light curves are generated by Occult4 software. The time duration shown ("Durn."), is the length of the plot in seconds, not the event duration.
Light
Curve interpretation. (see
simulations) (extreme example)
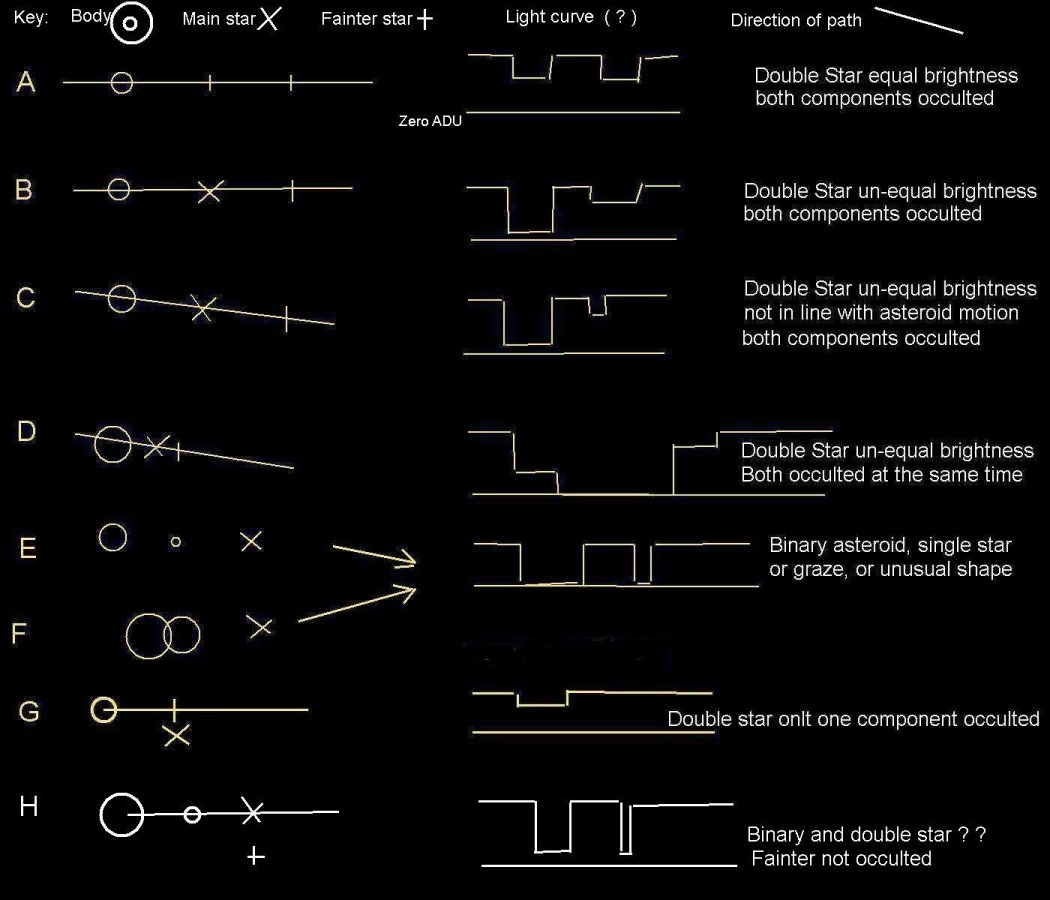
1) Should be at least 3 frames duration with S/N >= 3 ( 1 or 2 frames
are classed as "possible" )
2) Have a flat bottom and reach zero ADU (baseline)
3) Drop not reaching the baseline: The asteroid is detected, or the star
was double where one component was occulted. The analyst checks the observed
magnitude drop is consistent.
4) Light curves
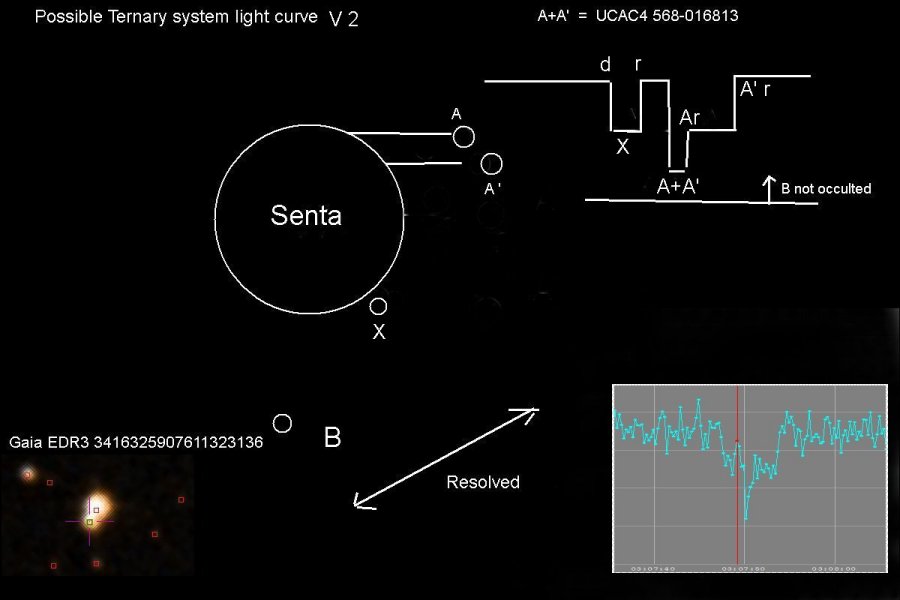
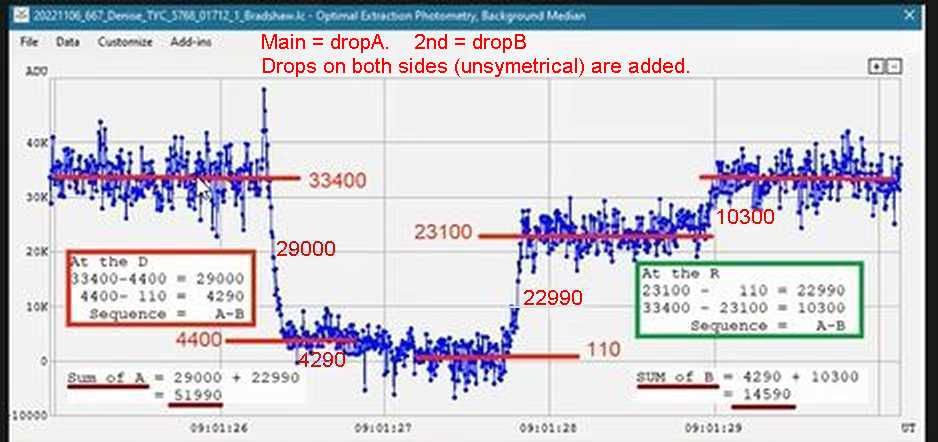
with steps: The star is double, components occulted in turn. See a complex
example here
5) More than one drop not reaching the baseline: a double star.
6) Two clearly
separated drops both reaching the baseline: A graze occultation, strange
asteroid shape, contact binary etc... ( to be investigated ! )
7) Short occultation
with pointed or curved bottom edge not reaching the baseline. Fresnel diffraction
effects are distorting the light curve.
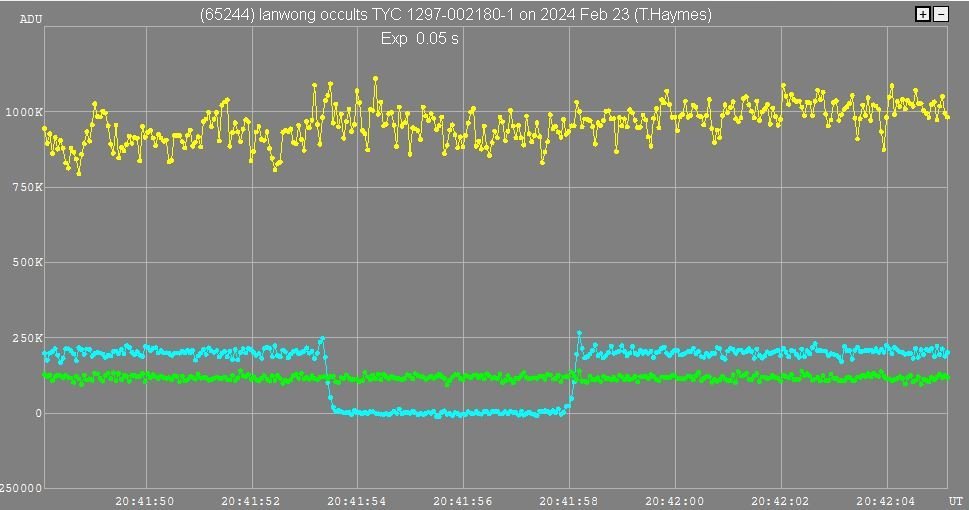
8) Positive going spikes at disappearance and/or reappearance: Diffraction
in ideal circumstances. Example: the asteroid
Ianwong is small, was slow moving and star bright.
UK Light Curves 2026:
Date |
Asteroid
|
Diam. |
Observer |
Duration |
Light
Curve |
Note |
2025-Dec-03.0 |
(50142)
2000 AY129 |
2.2 x 1.2
8.0 x 5.0 km |
S
Kidd (Stevenage) |
0.13
/ 0.53 s |
New
Binary ! |
|
2026-Jan-05.9 |
(45850)
2000 SH209 |
15
km |
T
Haymes (Steeple Aston) |
1.0
s |
||
Jan-06.3 |
(175469)
2006 QD127 |
9
km |
S
Kidd (Stevenage) |
0.27
s |
||
Jan-07.9 |
(99065)
2001 FA3 |
4
km |
S
Kidd (Stevenage) |
0.26
s |
||
Jan-10.9 |
(77671)
2001 MD13 |
8
km |
T
Haymes (Steeple Aston) |
0.56
s |
||
Jan-12.9 |
(5816)
Potsdam |
10
km |
T
Haymes (Steeple Aston) |
0.26
s |
near
grazing |
|
Jan-13.8 |
(17104)
McCloskey |
7
km |
A
Pratt (Leeds) |
0.50
s |
||
Jan-13.9 |
(58080)
4228 T2 |
5
km |
A
Pratt (Leeds) |
0.45
s |
4118%20T-2_APratt.png) |
|
Jan-14.2 |
(130859)
2000 UO81 |
4
km |
S
Kidd (Stevenage) |
0.31
s |
%20by%20SKidd.png) |
|
Jan
16.9 |
(72747)
2001 FR121 |
10km |
S
Kidd (Stevenage) |
0.99
s |
%20by%20SKidd.png) |
|
Jan
17.8 |
(821)
Fanny |
30
Km |
W
Stewart (Ravensmoor) |
2.24
s |
Fanny%20by%20Stuart.png) |
|
Jan
17.8 |
(8864)
1881 VU |
8
Km |
W
Stewart (Ravensmoor) |
1.6
s |
||
Jan
28.8 |
(897)
Lysistrata |
26
Km |
S
Kidd (Stevenage) |
2.0
s |
_Lysistrata%20both.PNG) |
C14,
exp 0.1s |
Jan
28.8 |
(897)
Lysistrata |
T
Haymes (Steeple Aston) |
2.4
s |
%20Lysistrata_2026%20Jan%2028.png) |
C11,
exp 0.2s |
|
Jan
|
||||||
Jan
|